Disney’s commitment to Mickey Mouse REDD: Conservation International’s trick baseline for the Alto Mayo project in Peru

The Alto Mayo Protected Forest in the Peruvian Amazon covers about 182,000 hectares. Although it became a protected area in 1987, it remained under serious threat. Today it is the site of a REDD project run by Conservation International with funding from Walt Disney.
In March 2013, Walt Disney bought 437,000 verified carbon units from the project at a total cost of US$3.5 million (US$8 per credit). Here’s a project set up by a major US NGO, with backing from a major US corporation, that has already sold hundreds of thousands of REDD carbon credits. The project is verified and validated under the Verified Carbon Standard (VCS).
The company that carried out the verification and validation process, Scientific Certification Systems, wrote in its validation report that,
The Project correctly applies the selected methodology element and is in conformance with all applicable requirements of the Verified Carbon Standard (VCS). The Project is designed to lead to reductions of GHG emissions that are real, measurable and give long-term benefits to the mitigation of climate change.
From 2009 to 2012, the project generated almost three million tons of emissions reductions. In order to generate all these REDD carbon credits, Conservation International has to be able to argue that in the absence of the REDD project, more deforestation would have taken place. Part of the process involves establishing the baseline – or what would have happened in the absence of the project. As REDD-Monitor has pointed out in the past, this is by definition tricky, because it’s measuring something that didn’t actually take place.
Of course, project developers would like to be able to argue that without their project deforestation would be rapid so that they can argue that deforestation is much slower with the project and they can generate more carbon credits (what would have happened minus what actually happened). That’s why VCS has developed a series of extremely complicated methodologies to determine baselines in different situations.
In the case of the Alto Mayo project, the methodology was VM0015, “Methodology for Avoided Unplanned Deforestation” (at only 208 pages long it makes for fascinating reading). The process of establishing the baseline for the Alto Mayo is explained in a Project Description (dated 15 June 2012, and available on the VCS website).
The process of establishing the baseline is described on page 106 of the Project Description:
Land-cover change data for the reference region were mapped by Conservation International, via analysis of Landsat-5 and Landsat-7 images, for the reference period of 1996 to 2006.
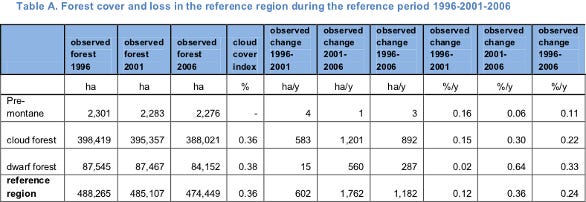
From an analysis of these maps, Conservation International calculated the area of forest and the area of forest lost for the period 1996 to 2006:
Between 1996 and 2001, the rate of forest loss was 0.12% per year. Between 2001 and 2006, the rate increased to 0.36% per year.
But if the rate of deforestation were to remain so low without a REDD project, Conservation International would be struggling to generate many carbon credits. Conservation International therefore introduced a new methodology in order to increase the baseline. On page 122 of the Project Description, Conservation International explain that they will use a “Cumulative Deforestation Model” as described in the VCS Methodology for Avoided Mosaic Deforestation of Tropical Forests (VM0009). Using this methodology, Conservation International managed to dramatically increase the baseline deforestation rate.
The rate of deforestation, illustrated by the green line has now miraculously increased to 1% per year – three times the rate the Conservation International found from the satellite data between 2001 and 2006.
Conservation International produced a series of maps of baseline deforestation using this new model. Here’s what Conservation International want us to believe would happen without the 20-year REDD project, which started in 2008:
The red area is forest loss. It looks horrific. That’s the purpose of these maps. But compare the map above of “what would have happened in 2008 in the absence of the project” with the actual deforestation between 2001 and 2006. Deforestation is also coloured red:
The deforestation between 2001 to 2006 is difficult to see. How is the huge area of deforestation coloured bright red on the 2008 map supposed to have happened in the two years between 2006 and 2008? And why did SCS verify and validate what seems to be a trick baseline? Or perhaps, since Walt Disney is buying the credits, we should call it a Mickey Mouse baseline.


